
You know that DDA algorithm is an incremental scan conversion method which performs calculations at each step using the results from the preceding step. Here we are going to discover an accurate and efficient raster line generating algorithm, theBresenham's line-drawing algorithm.
This algorithm was developed by Jack E. Bresenham in 1962 at IBM. As stated above, in this lecture, I will explain how to draw lines using the Bresenham's line-drawingalgorithm. And then show you the complete line drawing function. Before we begin on this topic, a revision of the concepts developed earlier like scan conversion methods and rasterization may be helpful. Once we finish this aspect, we will proceed towards exposition of items listed in the synopsis.
In particular, we will emphasize the following
(a) The working of Bresenham’s algorithm.
(b) Implementation of the Bresenham’s algorithm.
The working of Bresenham’s algorithm The following is an explanation of how the Bresenham's line-drawing algorithm works, rather than exact implementation.
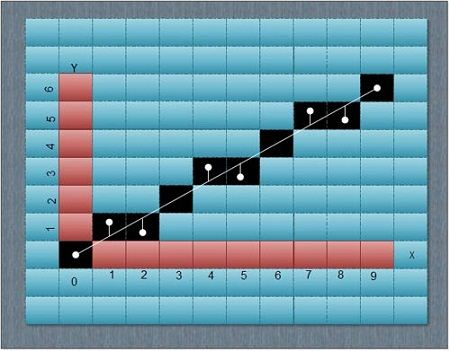
Let’s take a look at this image. One thing to note here is that it is impossible to draw the true line that we want because of the pixel spacing. Putting it in other words, there's no enough precision for drawing true lines on a PC monitor especially when dealing with low resolutions. The Bresenham's line-drawing algorithm is based on drawing an approximation of the true line.
The true line is indicated in bright color, and its approximation is indicated in black pixels. In this example the starting point of the line is located exactly at 0, 0 and the ending point of the line is located exactly at 9, 6. Now let discuss the way in which this algorithm works. First it decides which axis is the major axis and which is the minor axis.
The major axis is longer than the minor axis. On this picture illustrated above the major axis is the X axis. Each iteration progresses the current value of the major axis (starting from the original position), by exactly one pixel. Then it decides which pixel on the minor axis is appropriate for the current pixel of the major axis. Now how can you approximate the right pixel on the minor axis that matches the pixel on the major axis?
That’s what Bresenham's line-drawing algorithm is all about. And it does so by checking which pixel's center is closer to the true line. Now you take a closer look at the picture. The center of each pixel is marked with a dot. The algorithm takes the coordinates of that dot and compares it to the true line. If the span from the center of the pixel to the true line is less or equal to 0.5, the pixel is drawn at that location. That span is more generally known as the error term.
You might think of using floating variables but you can see that the whole algorithm is done in straight integer math with no multiplication or division in the main loops(no fixed point math either). Now how is it possible? Basically, during each iteration through the main drawing loop the error term is tossed around to identify the right pixel as close as possible to the true line. Let's consider these two deltas between the length and height of the line: dx = x1 - x0; dy = y1 - y0;
This is a matter of precision and since we're working with integers you will need to scale the deltas by 2 generating two new values: dx2 = dx*2; dy2 = dy*2; These are the values that will be used to change the error term. Why do you scale the deltas? That’s because the error term must be first initialized to 0.5 and that cannot be done using an integer. Finally the scaled values must be subtracted by either dx or dy (the original, non-scaled delta values) depending on what the major axis is (either x or y).
The implementation of Bresenham’s algorithm
The function given below handles all lines and implements the complete Bresenham's algorithm.
function line(x0, x1, y0, y1)
boolean steep := abs(y1 - y0) > abs(x1 - x0)
if steep then
swap(x0, y0)
swap(x1, y1)
if x0 > x1 then
swap(x0, x1)
swap(y0, y1)
int deltax := x1 - x0
int deltay := abs(y1 - y0)
real error := 0
real deltaerr := deltay / deltax
int y := y0
if y0 < y1 then ystep := 1 else ystep := -1
for x from x0 to x1
if steep then plot(y,x) else plot(x,y)
error := error + deltaerr
if error ? 0.5
y := y + ystep
error := error - 1.0
Note:-To draw lines with a steeper slope, we take advantage of the fact that a steep line can be reflected across the line y=x to obtain a line with a small slope. The effect is to switch the x and y variables throughout, including switching the parameters to plot.


